
Who can do what
Open Reports
Reports is in the Overview group of the left-hand navigation, next to Dashboard and Calendar. The Trends button on the Inspections page opens Reports on the Inspections tab; the Trends button on the Incidents page opens Reports on its default tab, so click Incidents there to see the incident charts. The page opens on the Inspections tab with Last 6 months selected, and the tab you are on is kept in the address, so a shared link opens the same tab.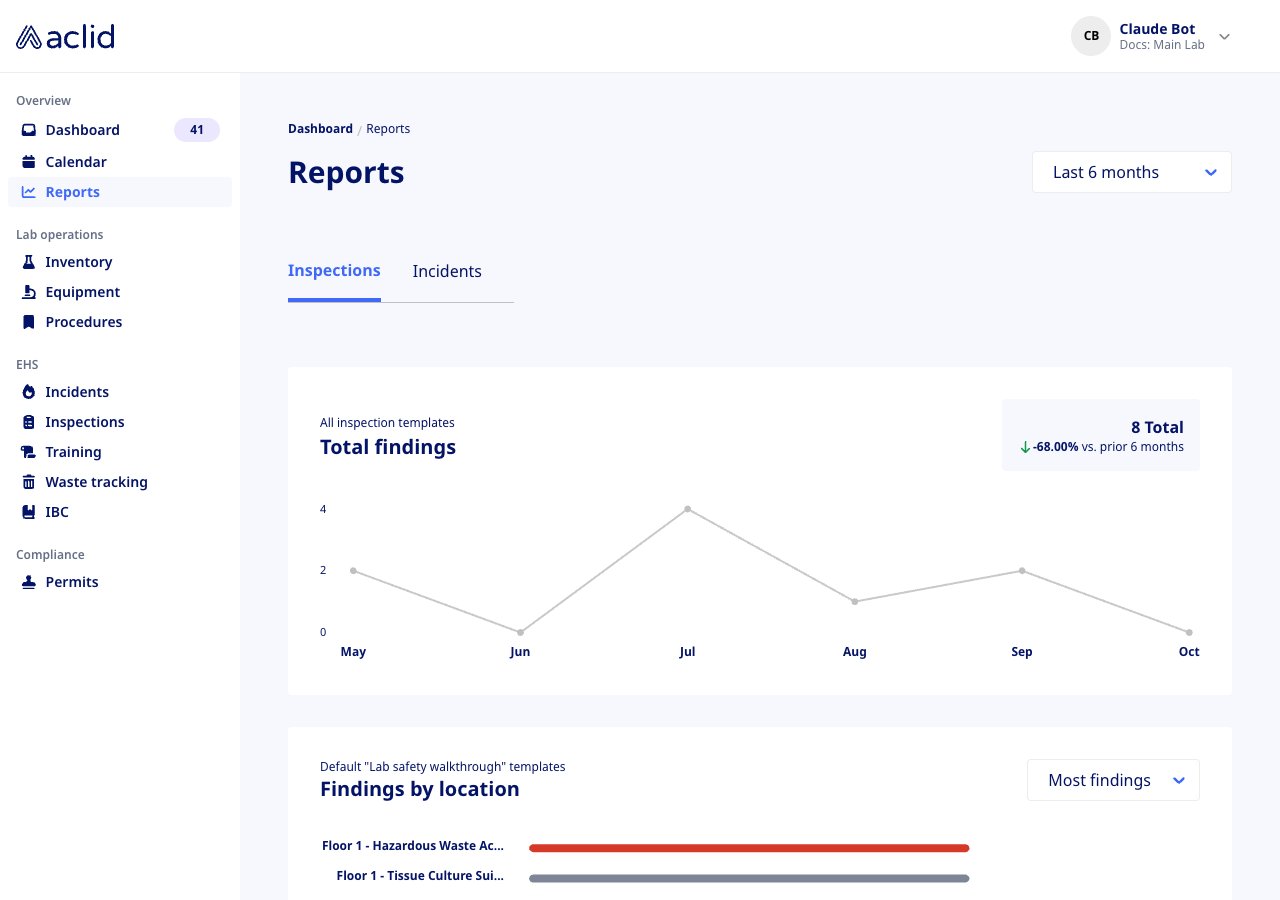
The Inspections tab on first open, with the date range at the top right
Key concepts
- Date range: the window every chart covers. It always ends with the current period (today, or the current calendar month), so Last 6 months means this month plus the five before it.
- Last 7 days: one point per day, labelled with the weekday, compared with the prior 7 days.
- Last 30 days: daily counts grouped into weeks, each labelled with the date the week starts, compared with the prior 30 days.
- Last 6 months: one point per calendar month, labelled with the month, compared with the prior 6 months. This is the default.
- Last 12 months: one point per calendar month, labelled with the month’s initial, compared with the prior 12 months.
- Comparison: the percentage change between the headline total and the same total for the prior window, shown as vs. prior 6 months (or 7 days, 30 days, 12 months). A red up arrow means more findings or incidents than before, a green down arrow means fewer, and a grey up-and-down arrow means no change. When the prior window had none at all, any count in the current window shows as a 100.00% increase.
- Finding: an inspection question whose answer was flagged as a problem. Reports counts findings, not inspections, so one inspection with three flagged questions adds three.
- Closed incident: an incident an admin has reviewed and closed, shown as Reviewed & closed in Incidents. The Incidents tab counts only closed incidents; reports that are still Needs review are not included until they are closed.
- Incident, Near miss, Good catch and Severe, Moderate, Minor: the incident types and severities set during reporting or review. Both donut charts always list all three values, including those at zero.
- OSHA reportable, OSHA recordable, Minor: the OSHA status groups in the “Everyone home safe every day” block. An incident whose admin answered Yes to the OSHA report question is OSHA reportable, one with Yes to the record question is OSHA recordable, and one with neither is Minor here. An incident can count in both OSHA groups.
Tasks
Read the inspection findings report
Admins only.
- Open Reports; the Inspections tab is selected by default.
- Read Total findings, labelled All inspection templates. The trend line shows findings per period, the tile at the right shows the Total for the window and the comparison with the prior window, and hovering a point shows its count and period.
- Scroll to Findings by location. It ranks locations by the number of findings raised in inspections there. Switch the select between Most findings and Least findings to see the top four or the bottom four; every location in the organization is listed, so locations without findings appear with a dot at zero instead of a bar.
- Scroll to Findings by category. It groups findings by the section of the inspection template that the flagged question belongs to, with the same Most findings / Least findings switch.
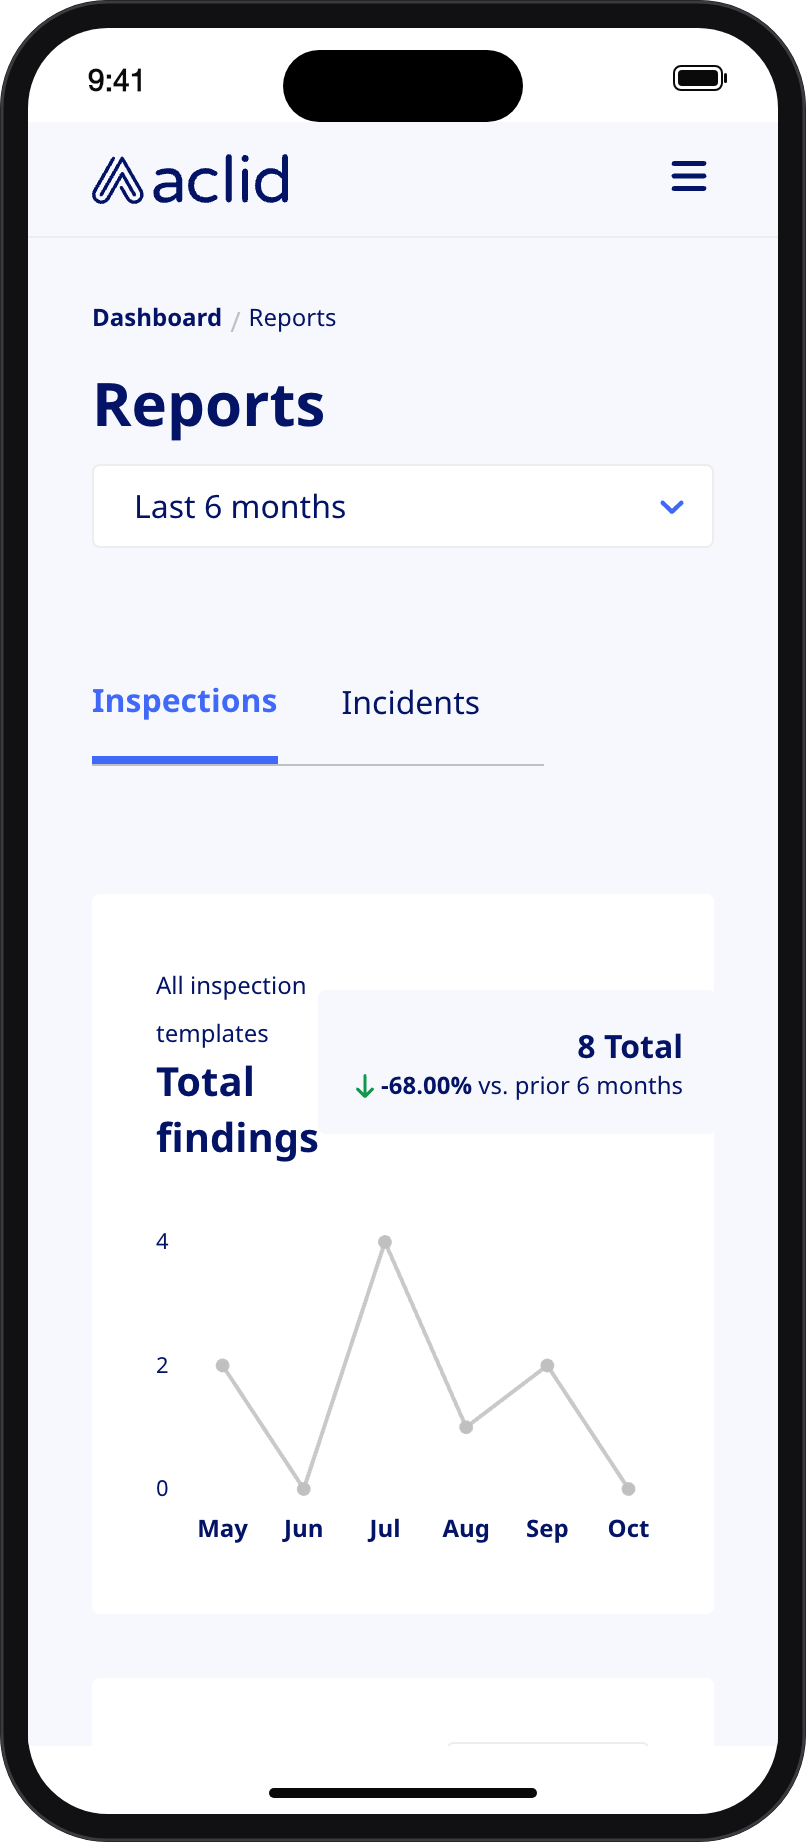
The Inspections tab on a phone
Read the incident report
Admins only.
- Click the Incidents tab.
- Read Total incidents: the number of closed incidents in the window with its comparison, and a trend line of closed incidents per period.
- Types of incidents and Severity of incidents split the same incidents by type and by severity, showing the count and share of each value.
- Incidents by location ranks locations, with a Most incidents / Least incidents switch that shows the top four or bottom four. Locations with no closed incidents are listed with a dot at zero instead of a bar.
- The “Everyone home safe every day” block shows three tiles, OSHA reportable, OSHA recordable and Minor, each with its count and the comparison with the prior window.
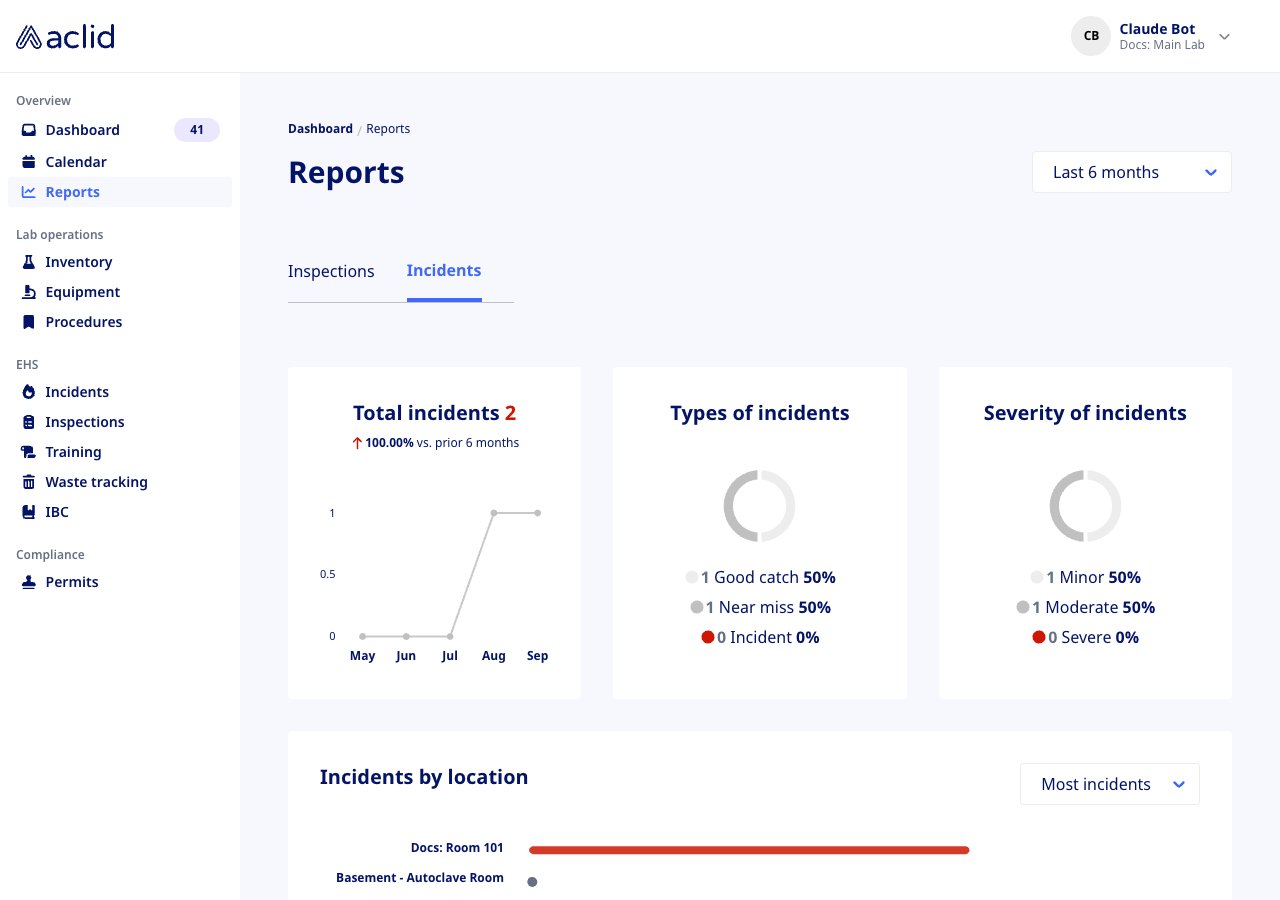
The Incidents tab: totals, types, severity, incidents by location and the OSHA tiles below
Change the date range
Admins only.
- Open the select at the top right of the page (it shows Last 6 months on first open).
- Choose Last 7 days, Last 30 days, Last 6 months or Last 12 months.
- Every chart on the current tab reloads for the new window, the x-axis labels change to days, weeks or months, and each comparison is recalculated against the prior window of the same length (vs. prior 7 days, vs. prior 30 days, vs. prior 6 months or vs. prior 12 months). The range applies to both tabs, so switching tabs keeps it.
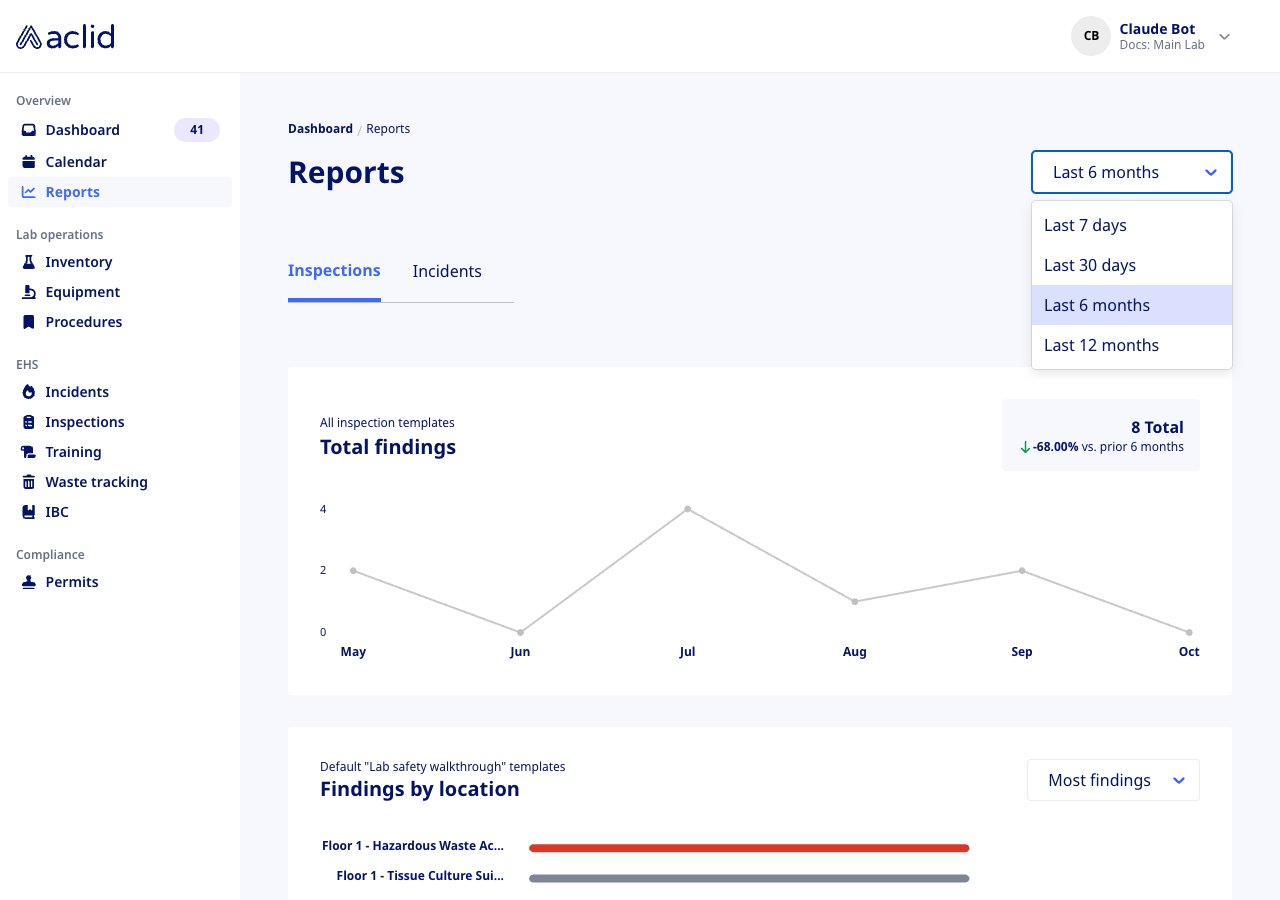
The four date ranges
Reading the list
- Total findings / Total incidents: the headline count for the window. Below it, an arrow with a percentage and vs. prior … compares it with the previous window of the same length. Red means up, green means down.
- Trend line: one point per day, week or month depending on the range. Hover a point for the exact count and its day, week or month.
- Donut charts (Incidents tab): each legend row shows the count, the label and its percentage of all closed incidents in the window.
- Horizontal bars: under Most … the red bar at the top is the location or category with the most, and the bars fade to light grey going down. Under Least … the order flips: the lightest bar at the top is the one with the fewest, and the purple bar at the bottom is the highest of those four. A location with none shows as a dot at zero. Bars are drawn to the same scale within a chart; the numbers along the bottom give the counts, and hovering a bar shows its exact count.
- Loading… appears briefly while a tab fetches its data after you open it or change the range.
Tips and limits
- Reports is admin-only. Members do not see it in the navigation, and opening the page by its address shows an access-restricted message.
- The charts cover the whole organization, not only the site shown in the header. Locations from every site appear in the location charts.
- Only closed incidents count. If a report you expect is missing, check whether it is still Needs review in Incidents; closing it adds it to the next load of the report.
- Findings are counted by the date of the inspection and incidents by their Date of occurrence, not by when they were entered or closed. A backdated incident lands in the period it happened in.
- Each location chart shows at most four bars at a time. Use the Most … / Least … switch to see the other end of the ranking.
- Reports has no export or print button. Use your browser’s print or screenshot function to share a view.
Related
- Incidents explains how incidents are reported, reviewed and closed, which decides when they appear here.
- Roles and sites explains the admin and member roles.
- reports, InspectionReport and IncidentReport in the GraphQL reference.